The Monthly Business Dashboard We Use to Grow Our Bookstore (And How You Can Build One for Your Business)
Every month, before we start planning the next one, our family sits down with a single dashboard.
It isn’t flashy.
It isn’t complicated.
It’s simply a page filled with numbers, progress bars, goals, notes, and reminders.
And honestly, it’s become one of the most valuable tools we have.
When people ask how Paper & Vine is doing, they usually expect us to talk about sales.
Sales matter.
But after opening our bookstore, we realized something pretty quickly:
One number can never tell the whole story.
A month with record sales might also include higher labor costs.
A slower month might be the one where our email list grows the fastest.
Pinterest might double while event attendance drops.
One department can struggle while another quietly reaches a milestone.
Businesses are living, changing things.
Trying to judge them by one metric is like trying to judge a book after reading only one chapter.
That’s why we built our monthly dashboard.
Not to create more work.
To help us make better decisions.
Our Goal Isn’t a Perfect Month
If you look closely at our dashboard, you’ll notice something.
Not every progress bar is full.
Not every goal was reached.
Some sections are ahead.
Some are behind.
We leave them exactly that way.
Because our goal isn’t perfection.
It’s progress.
Every month we ask ourselves one question:
“Is Paper & Vine healthier than it was last month?”
That’s it.
If the answer is yes, even by a little, we’re moving in the right direction.
Why We Track More Than Revenue
Revenue is important.
But it doesn’t tell us:
- Are we buying inventory wisely?
- Are customers coming back?
- Are we building an online community?
- Are we consistently creating content?
- Are we spending our time on the right things?
- Are we preparing for the future instead of reacting to it?
Those questions require different numbers.
And together, those numbers tell a much richer story than revenue ever could.
The Five Categories We Review Every Month
When we designed our dashboard, we didn’t start by asking, “What numbers should we track?”
Instead, we asked:
“What kind of business are we trying to build?”
The answer shaped everything.
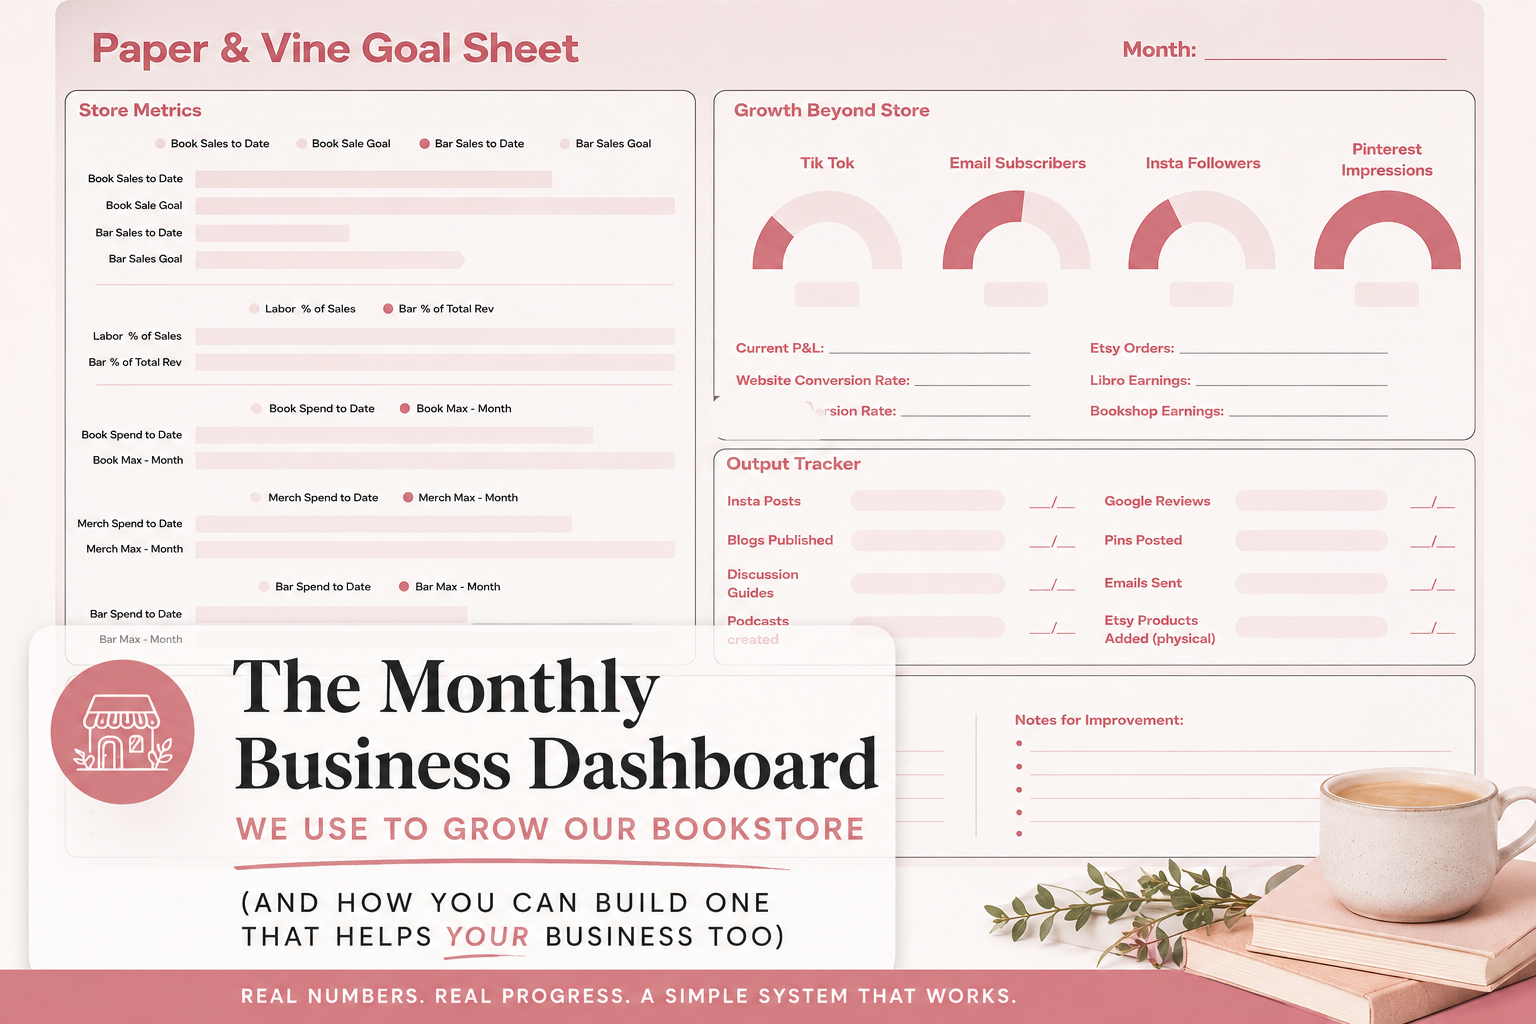
1. Store Health
This section tells us whether the bookstore itself is operating well.
We review things like:
- Book sales
- Bar sales
- Labor percentage of sales
- Inventory spending
- Merchandise budgets
These metrics help us stay disciplined and ensure P&L stays in the black.
Growing sales doesn’t mean much if expenses grow even faster.
2. Growth Beyond Our Store
One of our biggest goals is making Paper & Vine more than just a local bookstore.
We want someone across the country to discover one of our blog posts.
Download a printable.
Join our newsletter.
Order a book through Bookshop.
Listen through Libro.fm.
That’s why we also measure things like:
- Pinterest impressions
- Website traffic
- Email subscribers
- Social media growth
- Online partnerships
These aren’t vanity metrics to us.
They’re signs that our community is growing.
3. The Work That Creates Future Results
This section might be the most important one on the page.
- Because it focuses on the things we actually control.
- How many blog posts did we publish?
- How many Pinterest pins did we create?
- How many emails did we send?
- Did we launch new products?
- Did we create discussion guides?
Those activities don’t always produce immediate results.
But they’re planting seeds.
Every blog post becomes another door people can walk through.
Every Pinterest pin has the potential to bring readers months from now.
Every email strengthens a relationship with someone who already believes in what we’re building.
Results usually lag behind consistent effort.
That’s why we measure the effort too.
4. Reflection
One of our favorite sections doesn’t contain numbers at all.
Every month we write down:
- What worked.
- What didn’t.
- What surprised us.
- What we’ll change next month.
Sometimes one sentence written in June saves us from making the same mistake in October.
Improvement starts with paying attention. News isn't always good, but not knowing leads to red months, no direction and no clear path to success.
Financial and growth success for us really means we get to serve more people, get more books in more hands and ensure everyone feels like we are in their community.
5. Looking Ahead
Finally, we make notes about the future.
Large inventory orders.
Upcoming events.
Marketing campaigns.
Seasonal products.
Ideas that aren’t ready yet.
Planning ahead gives us margin.
Instead of constantly putting out fires, we can spend more time building something intentional.
A Small Peek Inside Our June Dashboard

We don’t share every financial detail publicly, but here are a few milestones we celebrated this month.
- Pinterest impressions passed 30,000.
- Our email community grew to over 2,100 subscribers.
- Instagram grew past 4,100 followers.
- We published seven blog posts.
- We created 100 fresh Pinterest pins.
Some goals were met.
Some weren’t.
That’s okay.
The unfinished progress bars are just as valuable because they show us exactly where to focus next, and how big to set next months targets to gain meaningful growth in areas we care about.
Build Your Own Dashboard
If there’s one idea, we’d encourage every business owner to borrow, it’s this:
Don’t copy someone else’s metrics. Build your own.
A photographer probably doesn’t need to track inventory spending.
A bakery may never care about Pinterest impressions.
A blogger isn’t measuring bar sales.
Your dashboard should reflect the business you’re trying to build.
Start by asking yourself:
- What are the five most important areas of my business?
- What numbers actually help me make better decisions?
- Which metrics show future growth, not just today’s results?
- What work should I celebrate even before it pays off?
- If I reviewed this dashboard every month for five years, would it help me build a healthier business?
Those answers become your scorecard.
Not because someone on the internet said you should track them.
Because they’re the numbers that matter to your mission.
Small Improvements Compound
One extra blog post.
A few more email subscribers.
Better inventory decisions.
One additional five-star review.
A stronger profit margin.
None of those feel life-changing on their own.
But month after month, they begin stacking on top of each other.
That’s how we’re trying to build Paper & Vine.
Not by chasing perfect months.
By making hundreds of thoughtful, intentional improvements over time.
And every month, this dashboard reminds us exactly where to make the next one.
Download Our Blank Monthly Dashboard
If you’d like to create your own version, we’ve included a blank copy of the dashboard we use each month.
Whether you own a bookstore, boutique, coffee shop, blog, Etsy shop, or you’re just beginning your entrepreneurial journey, we hope it helps you focus on the numbers that matter most to your business.
Downloadable Canva Link Here
Because the best dashboard isn’t the one with the prettiest charts.
It’s the one that helps you build a business you love.


